Data analysis, numerical modeling and advanced visualization.
Support for the entire life cycle of an application.
Implementation of systems based on embedded technology and parallel computing.
High-level teachers with specific knowledge.

The toolkit for interactive data analysis and visualization.
iChart includes dozens of charts for representing 2D, 3D and nD data. It allows the management of simultaneous events on multiple charts and the creation of interactive infographics. Includes support for machine learning algorithms for trend analysis and pattern identification.

Modeling based on discrete events.
iFlow is the process simulation tool based on an interactive graphical environment. The flow models used are focused on discrete event simulation and stochastic queuing theory. This numerical technique is used to analyze production and logistics flows, process efficiency, failure models.

Integrated management of laboratory data.
iLab is an advanced ELN (Electronic Laboratory Notebook) system that is extremely flexible and customizable based on the needs of each of our partners. It includes features for managing reagents, defining workouts and interactively representing analytical data. Incorporates tools for molecular design and computational chemistry.

A toolset for classification, optimization and prediction based on artificial intelligence.
iLearn supports dozens of different machine and deep learning algorithms. It finds applications in the field of pattern recognition and risk metrics determination.

A modeling environment based on simulation agents.
iSim implements calculation models through the definition of 'objects' that populate a scenario and 'agents' that modify the position and shape of the objects themselves during the evolution of the simulation.

A simulation tool based on stochastic calculation.
iChain is based on years of expertise in the field of Monte Carlo modeling and the use of Markov chains to implement forecasting tools. It finds application in the field of risk calculation, combinatorial calculation and in the simulation of complex phenomena.
Mario Vescovi, Enrica Angiolini, Giovanna Arcuri Network Data Analysis
Network theory is the study of sets of discrete objects linked by connections with symmetric or asymmetric topology. In computer science, network theory is part of graph theory: a network can be defined as a graph in which nodes represent discrete objects with well-defined attributes interconnected through lines and arcs which are in turn characterized by parameterizable properties. iTree is a graph analysis tool that allows you to interactively visualize the structure of networks and simulate diffusive and percolative processes through discrete agents. The hierarchical structure of the data can be navigated according to different approaches which become essential for advanced data mining activities and support for business analytics applications.
Mario Vescovi, Enrica Angiolini Radiometric Data Analysis
OpenRAD is a suite of tools for the analysis and visualization of radiometric data. It allows you to define scenarios interactively and manipulate data from measurements and/or simulations of flow (neutron and gamma) and dose. It implements advanced data gridding and production of intensity and isodose maps. It allows you to visualize radiation flows both through particle tracking and texturing maps on even irregular surfaces. It supports latex volumetric visualization functionality and is able to exchange data with the OpenMC and MCNP radiation modeling environments. It manages data scattered in plane and in space and supports mapping functions for the processing of georeferenced data.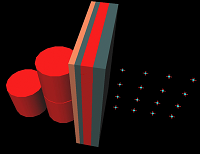
Mario Vescovi Neutron Transport Modeling
OpenMC is a computing environment developed in collaboration with MIT in Boston for modeling neutron transport mechanisms in matter. Based on a Monte Carlo simulation code, it allows the definition of calculation geometries through a Solid Constructive Geometry approach. iScience dealt with the integration of routines for the automatic generation of finite cell (lattice) calculation grids. The generation procedures were optimized using GPU-based parallel computing methods (OpenCL). Tools for the hierarchical definition of models and OpenGL viewers for viewing the results have also been implemented.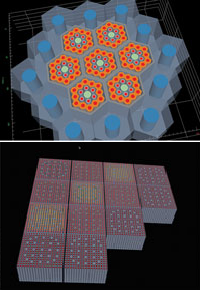
Mario Vescovi, Stefano Giovanelli Radiotherapy Planning
DPM is a calculation code based on the Monte Carlo method for the development of treatment plans in radiation oncology. Inherited from the PENELOPE simulation environment, it simulates the dose released in the patient starting from calculation grids defined through 3D arrays. iScience oversaw the porting of the code to the OSX environment and in particular the integration into the OsiriX platform. 3D grids can thus be defined starting from tomographic images in DICOM format. Support for sources regulated by lamellar collimators (multileaf) has also been implemented. The code is used for research purposes in the oncology field.
Mario Vescovi, Pascal Giasson, Carlo Dini Wells Data Viewer
XWells is a viewer based on web technologies (Javascript) for the interactive visualization of well data using combined charts. Designed to support data analysis activities in the extraction sector (oil & gas), it supports various typical formats of well logs and allows you to simultaneously view multiple parameters of interest. It supports various types of scales and includes a routine for the automatic generation of interactive reports.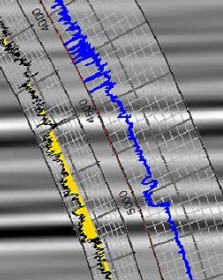
Mario Vescovi, Enrica Angiolini Web Application
XPubblisher is an OsiriX plugin developed to allow you to export and publish tomographic data on the web. Based on the DICOM Data Format it allows you to use the browser to view volumetric models and perform orthonavigation. It supports volume rendering and the representation of vector models, allowing you to visualize particular anatomical or prosthetic structures. It can also be used for exporting tensor brain imaging data to the web.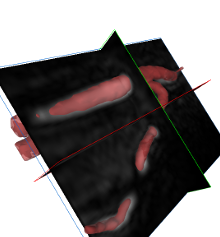
Mario Vescovi, Enrica Angiolini, Cristina Valcareggi DICOM Viewer
XProfiler is an OsiriX plugin for interactive perfusion analysis. Starting from time stacks of DICOM images, it allows you to extract local perfusion curves and perform real-time fitting of the same for the purpose of monitoring pharmacokinetics. Developed for a clinical research trial in the oncology field, it can also be used to support the analysis of MRI sequences in the neurological field. Perfusion data can be published on the web for dissemination to a scientific community.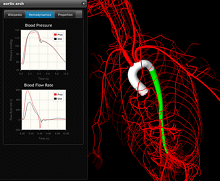
Mario Vescovi, Pascal Giasson, Andrea Ribasi Seismic Viewer
XSurvey is a web service for the publication of seismic interpretation data on Google Earth to support extraction activities in the oil & gas sector. It supports the Seg-Y format and includes tile management of raster data. It encapsulates a seismic data inversion routine based on a parallel solver of the acoustic wave propagation equation in heterogeneous media. Code parallelization is supported on GPUs through OpenCL.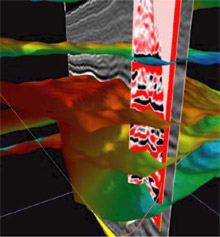
Email: info@iscience.it
Website: www.iscience.it
Address: Piazza della Repubblica, 1/A
20121 Milano, Italy
P. IVA: 06877760964